
Depending on the membership class, the number of runner views, as well as the range of graph analysis functions and reports, may be limited.
The manual here is explained for free members.
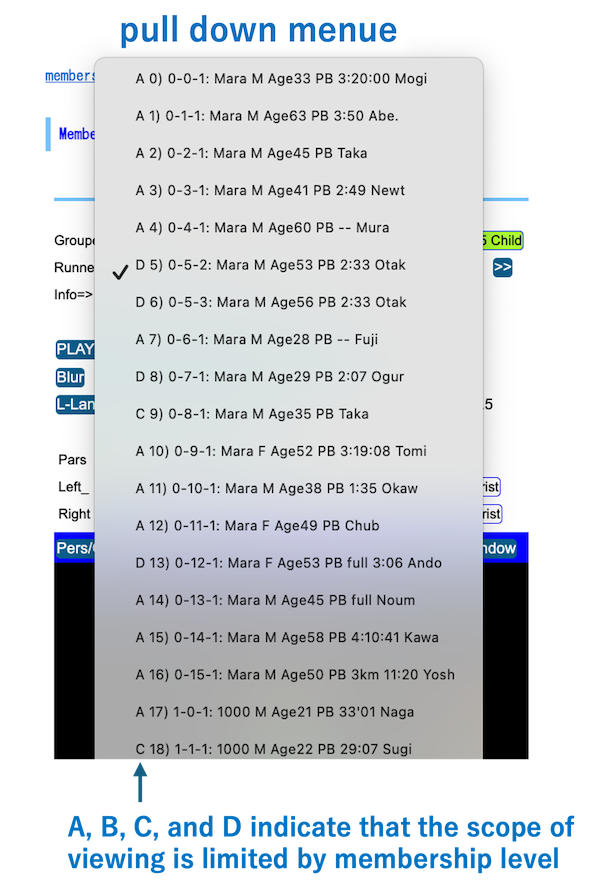
Select runner
Choose runner group, such as M/F: Male, Female, Marathon, etc.,
And select a runner from the pull down menu.
Selected runners are limited by your membership level. Flag of A, B, C, D ahead of the array indicate the permission level.
And see also Runners List.
Controler of Animation
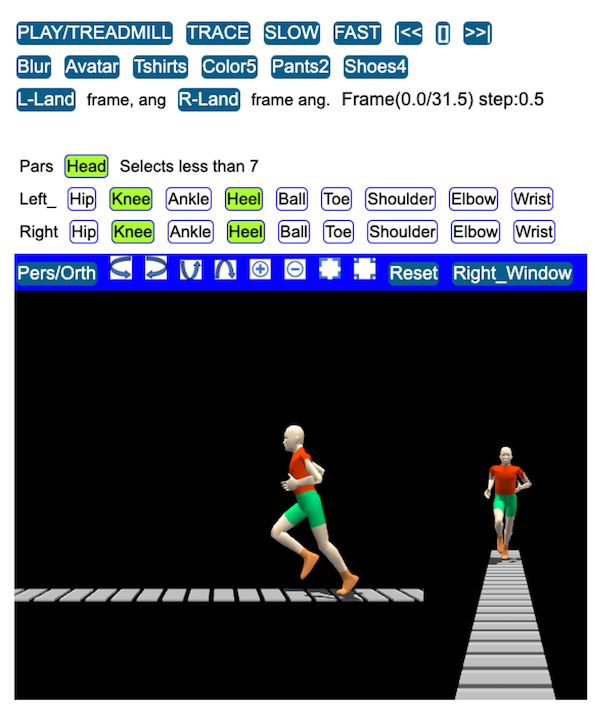
PLAY/TREADMILL plays an animation, switching between scenes of running forward in a field or running on a treadmill virtually.
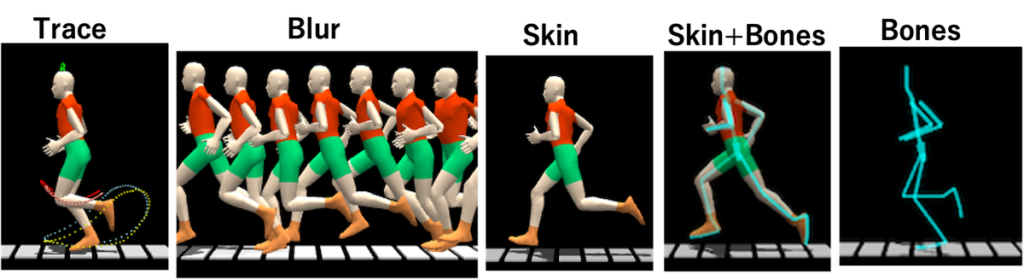
TRACE draws lines on the animation showing the path of movement of the various parts of the runner’s body. And chose body’s parts you would like to draw trace lines.
Blur superimposes the animation of the runner’s movements on the sequence.
|<< [] >>| step back, stop, step forward
Avatar switches a skin or bones
Tshirts Color Pants Shoes changes runner’s body color
Graph the movement
The following example graphs the vertical head movement as time (frame number) on the horizontal axis.
Drawing Single data
(1) left pull-down menue to select an item.
(2) then press Graph will show a Graph.
- Bottom long bars indicate the landing period in a left and a right leg respectively.
- The dots show the raw data and the solid line is show the modeled line.
( Model/Raw button switches drawing between them and both)  Erasing, shrinking, expanding, going down , going up in parallel vertical movement
- Off/Centering To compare two sets of data, the two data are moved vertically by each mean value
- Download outputs the raw and modeled data as a csv data.
- Some buttons with gray color do not work by limitation due to the level of membership you are log in.

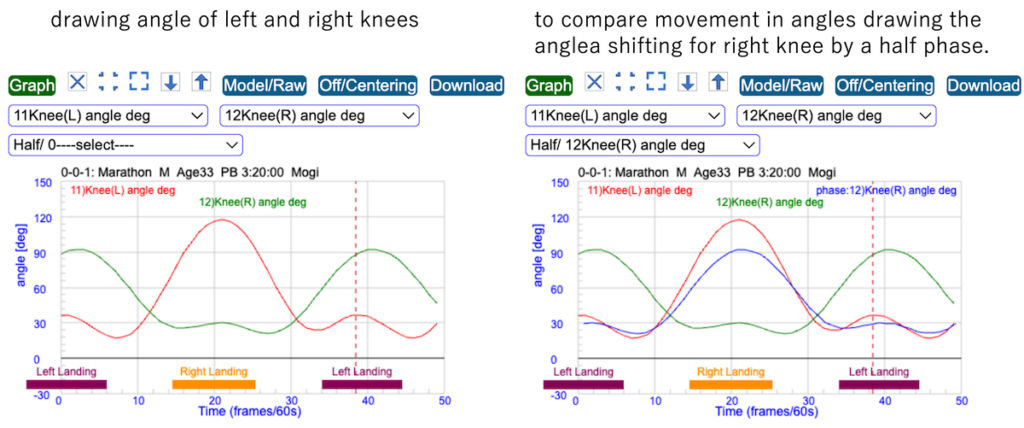
Drawing two datas and Comparing them efficiently
You can compare the motion characteristics between such as angles in left and right legs.
- left and right pull-down menue to select two items, left knee angle and right knee angle.
- press Graph then it will show a Graph. (see left Graph)
- adding the third pull-down menu, selecting items shifting the data by the Half phase.
- press Graph again, it add the line shifting by a half phase, blue line, as you can see the right graph below. This clearly shows the differences between two datas in detail.
Compare indicators with other runners
As form indicators vary from person to person, the graphics here is used to compare where the runner’s indicator stand amongst those of all runners.
It also estimates the centre of the raw data distribution, which is considered as a part of the physical phenomenon of running as a movement even if the speed differs.
And it is useful to evaluate individual characteristics from those differences.
- Select two indicators of x: and y: (e.g. speed and stride) from the each pull-down menu and click Graph, alternating display and erase with each click.
- Pressing Approx. button draws approximate curves with different order approximations.
- Then pressing Hist draws a histogram of the distribution in differences between the raw data and the value estimated from the approximate curve.
The solid line is the normal distribution curve when the standard deviation is calculated and assumed to be normally distributed. - W(-) W(+) are to change the width of bars of the histogram.

The values of ±5 in horizontal axis correspond ±2 sigma, 95% of the data within this range. The values for the relevant runner are marked with a circle in the diagram.
It is also possible to change the population group of the distribution, e.g. 0(Marathon) and 1(5k-10k).
If the back color of the button is white, the running group is excluded from the population.
Form Indicator Distribution/Deviation
6.Distribution of indicators on a runner
Clicking the button displays where the relevant runner indicator is distributed among the rest of the runner population. The symbol of ” * ” in – deviation + in the table visibly indicates the deviation from the standard center.

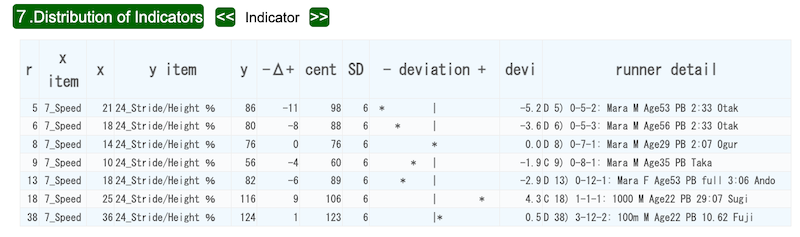
7.Distribution of Indicators over all runners
Clicking the button displays where the selected indicator is distributed among the rest of the runner population all over the runners in the group you selecting.
Form Indicators and comment
1.Key Indicators
Major indicators are shown here.
2. Assesments 3 Summary 4 Comments & Graphics are old functions, not displaying for the almost of runners.
Detailed Indicator
It shows a table of all indicators for a runner.